

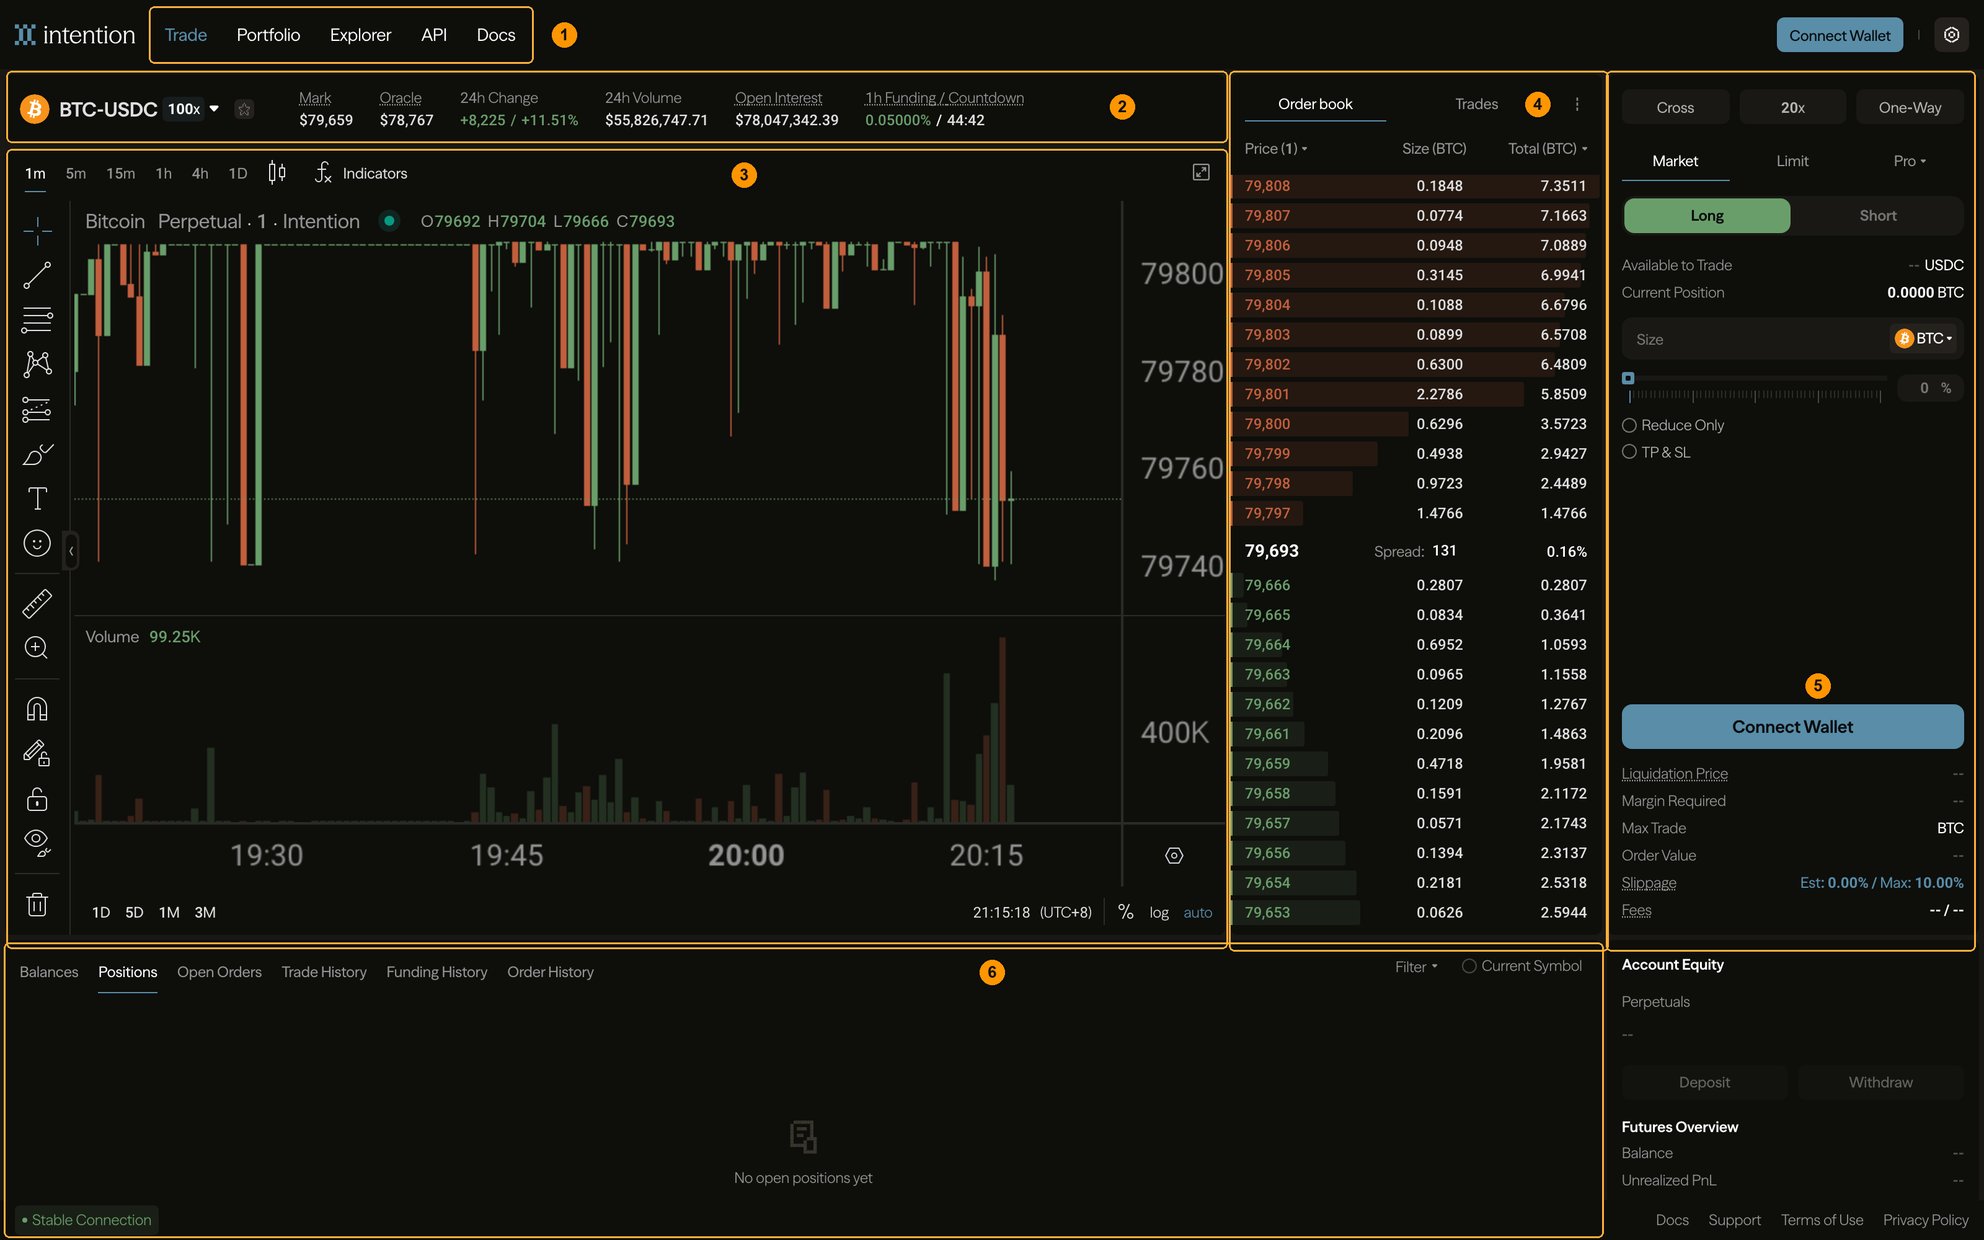
2. Market header
The row that tells you what you are trading and what it is doing.
100x here) is a property of this contract, not of your account.
2 — Mark price. The price your position is valued at. This drives your unrealized P&L and your liquidation — not the last traded price. It is deliberately smoothed so a single print cannot move it. See Mark price.
3 — Oracle price. The external reference the network agreed on through consensus. Mark price is anchored to it. See Index price.
4 — Open interest. Total size held open in this contract. It tells you how much position exists, which is a different question from how much has traded.
5 — Funding and countdown. The current rate and the time until it settles. Positive means longs pay shorts; negative is the reverse. If you hold through the countdown, this is charged or paid. See Funding.
Mark and Oracle sitting slightly apart is normal — mark tracks this venue’s book, oracle tracks the outside world. A large, persistent gap is worth understanding before you size a position, because funding is what closes it.
3. Chart
Standard candlestick charting with timeframes from 1m to 1D, indicators, and drawing tools down the left edge. The Chart / Depth toggle at the top right swaps the price chart for a depth view of the book. The chart is a reading aid. Nothing on it affects your order — the numbers that matter for execution are in the header and the ticket.6. Positions and history
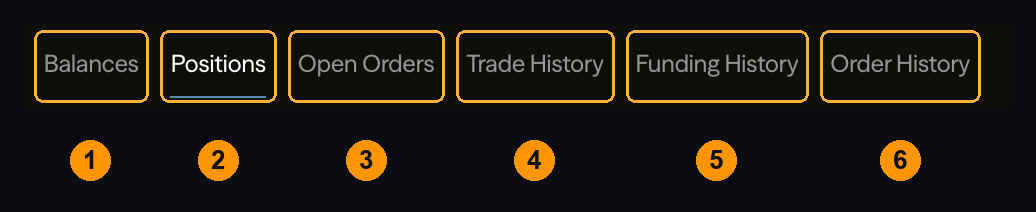
The distinction between Trade History and Order History catches people out. An order that filled in five pieces is one row in Order History and five rows in Trade History — because fees are charged per fill, not per order.
Funding History is its own tab for a reason: funding is not a fee and does not appear in Trade History. If your balance moved and you cannot find a trade explaining it, look here first.
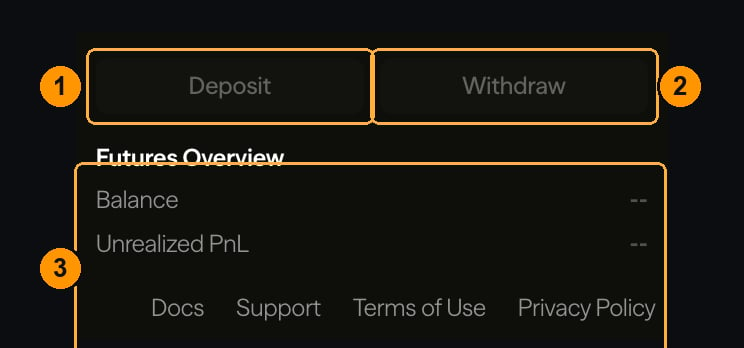
Account and funding
The connection indicator
Bottom left shows connection state. Stable Connection means the screen is receiving live updates. Worth glancing at before you act on a price. If the connection drops, the numbers on screen are the last ones received rather than the current ones — and the book you are looking at may no longer be the book you would trade into.Where to go next
The order ticket
Every control, and what it does to your order.
Reading the order book
Bids, asks, spread, and depth.
Your first trade
A worked example, start to finish.
Positions and history
Finding a fill, a fee, or a funding payment.